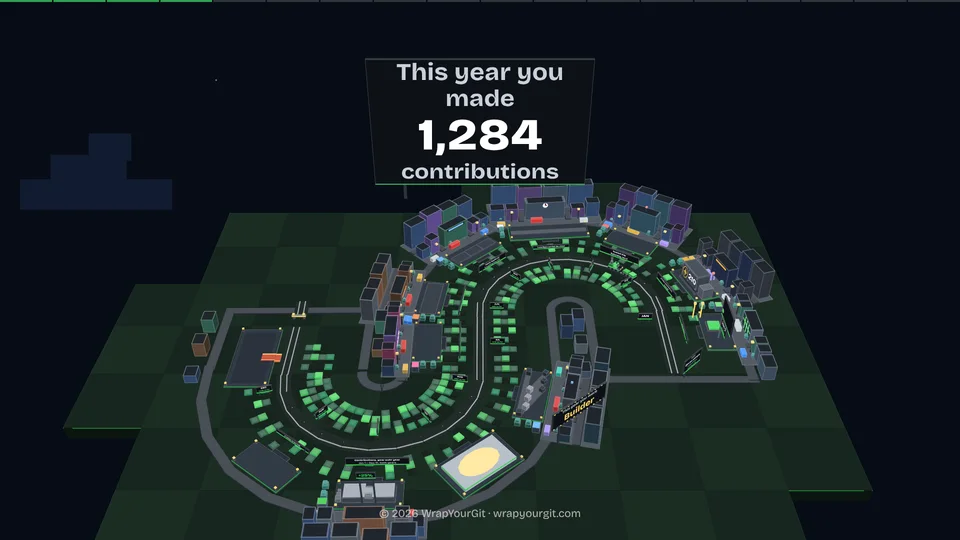
Arrival & the city grid
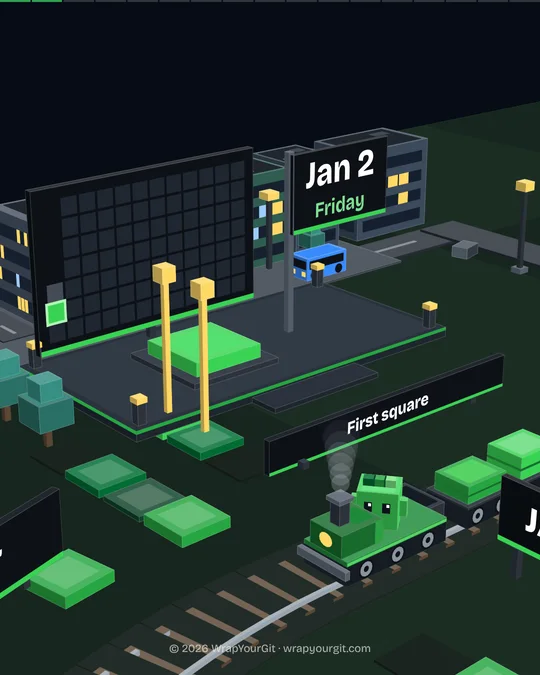
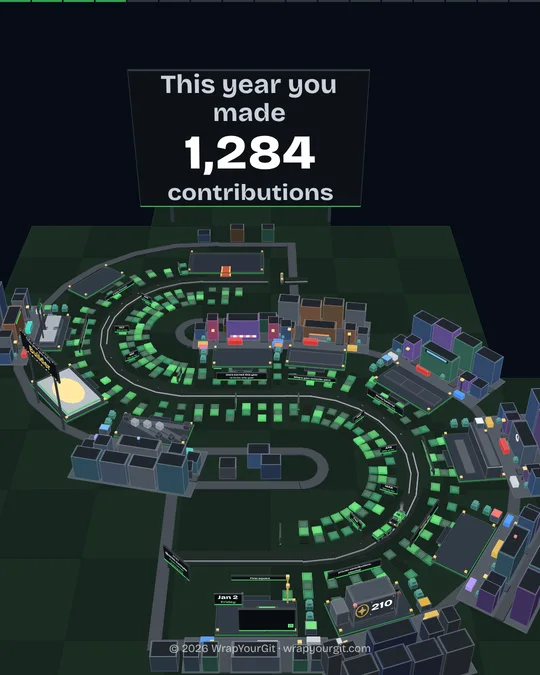
Your first day, then every day of the year rising into a city, up to your busiest.
Type a GitHub username and watch 2026 play back as a short story. Sign in to add your private work.

Every day becomes a building, and a train rides through 14 stops of your year.
Your first day, then every day of the year rising into a city, up to your busiest.
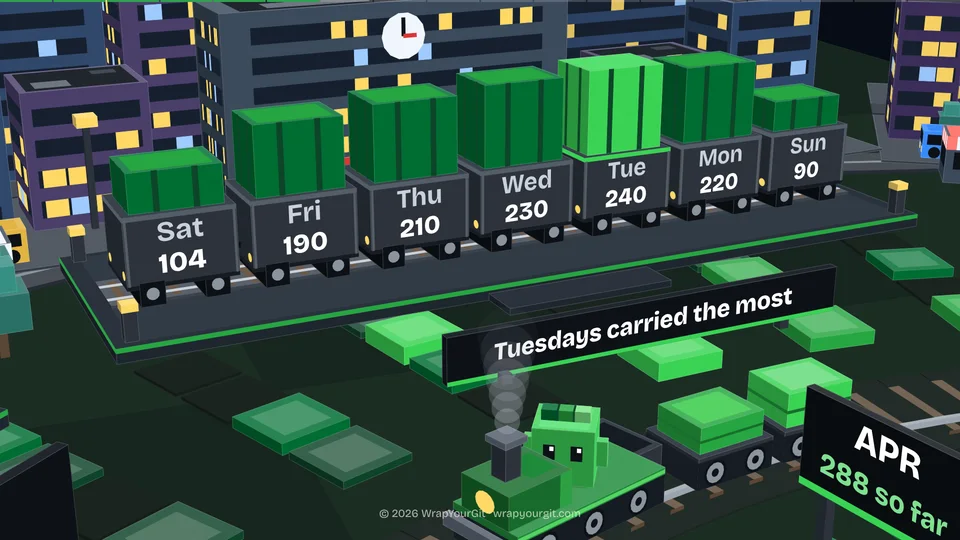
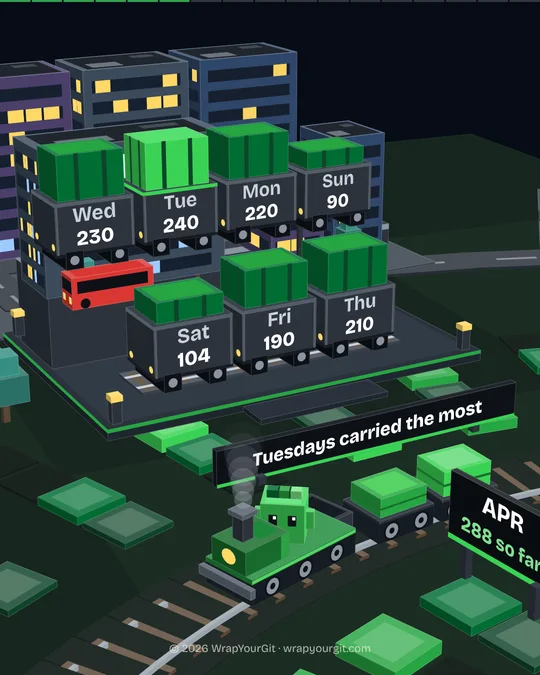
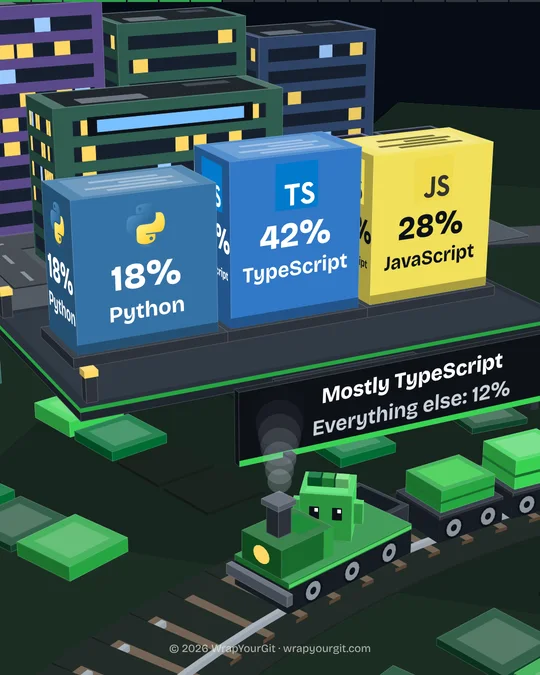
Your weekdays, your languages, your projects, stars, pull requests and reviews.
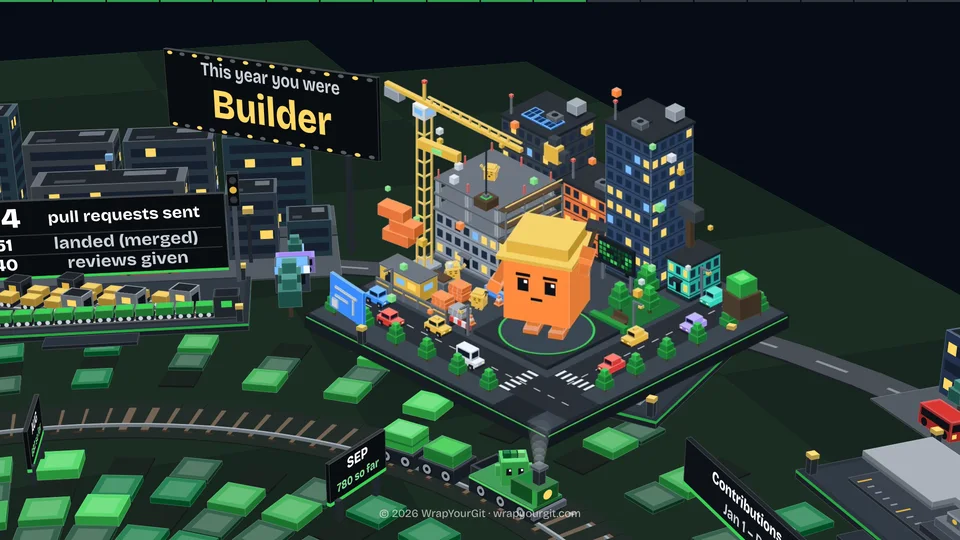
Your archetype, this year against last, and a letter from Cell.

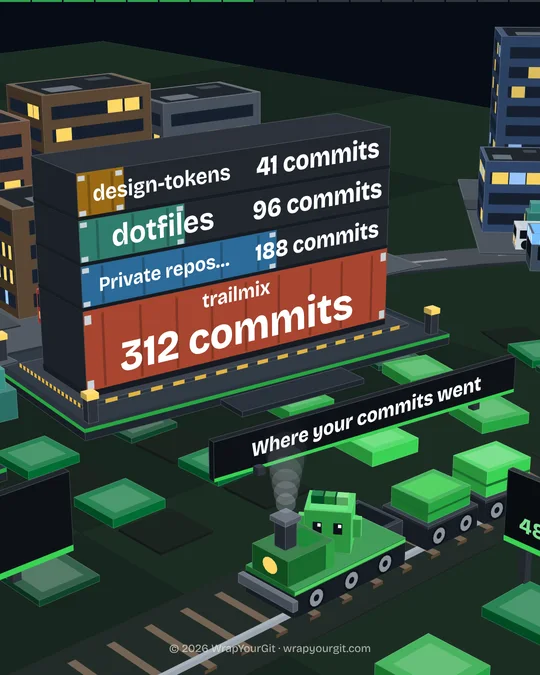
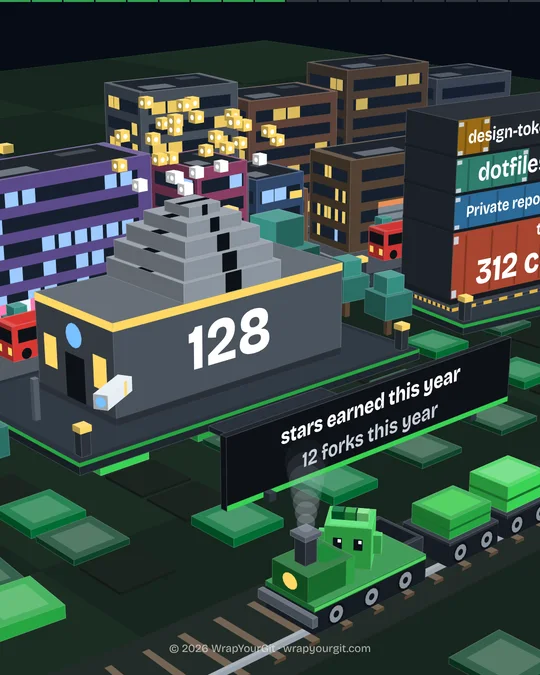
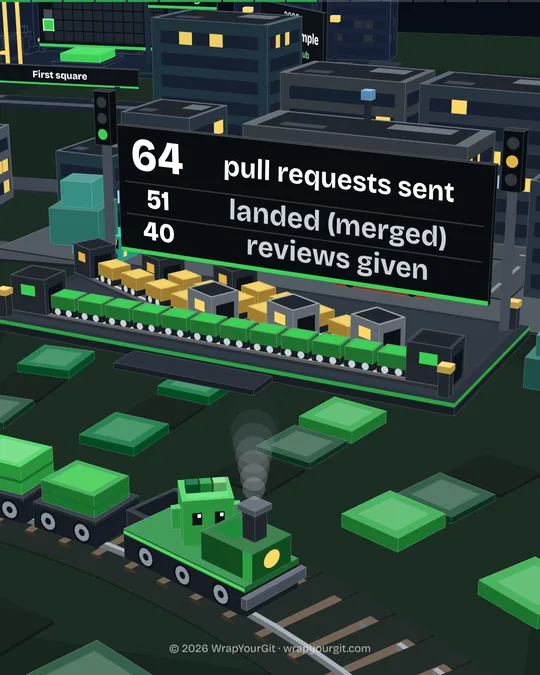

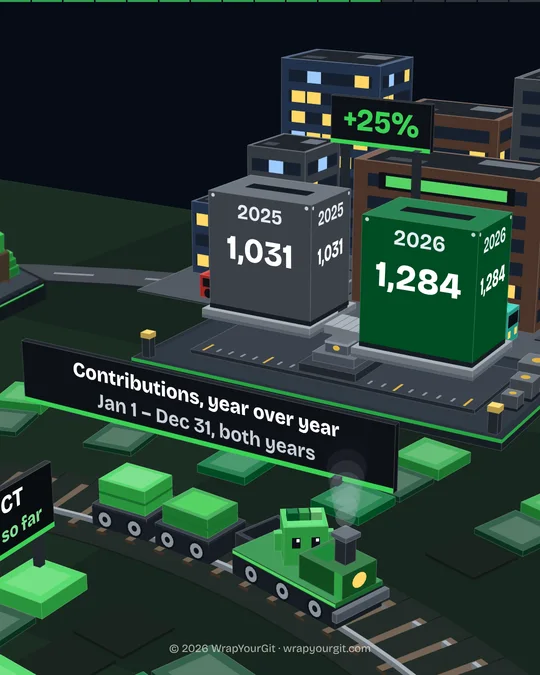
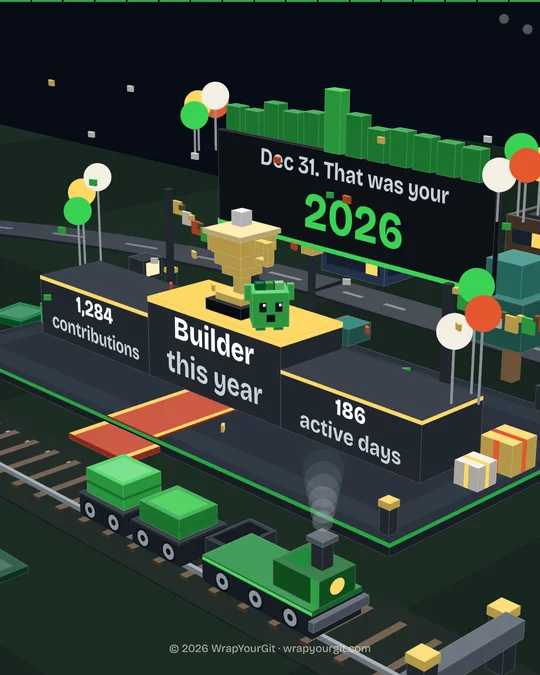
What GitHub doesn't give us shows as unavailable, never as 0. Anything worked out from partial data is labelled an estimate.
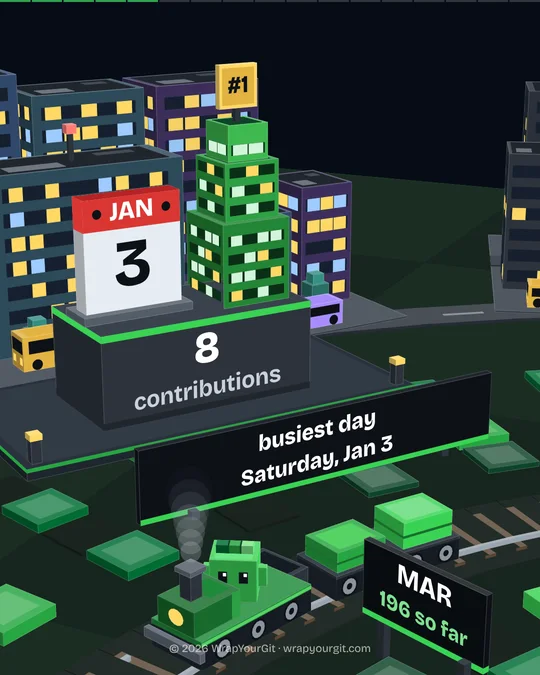
Commits, pull requests, reviews and issues combine into one daily height. Your longest streak and busiest day are pinned on the grid.
A vendored bundle never steals your top language. Shares come from the repositories you actually committed to in 2026.
Running your recap mid-year compares Jan 1 through today against Jan 1 through that same date last year, and labels estimated values clearly.
One archetype, picked by plain rules, with the facts from your year that earned it.

3+ repositories created, or commits are your main signal across the year.

200+ active days, or a 30+ day streak on your contribution calendar.

6+ programming languages with at least 3% commit share each.
Reviewing for others, working late, or building in public.

Reviews + pull requests make up 25%+ of your total activity, with 20+ reviews.

35%+ of your commits land between 22:00 and 04:59 in your local timezone.

80%+ public contributions across 5+ repositories, or 50+ stars earned this year.
A short note at the end of the ride, filled with your numbers. Written from our own templates, never by a language model.

“What a year. You showed up again and again, and your graph is the proof: green spreading across the months like a city being built.”
“You found a rhythm this year. Not every day, not every week, but often enough that the work kept moving, and that is how real things get made.”
“This was a quiet year on GitHub, and quiet is not the same as nothing. Every one of those commits was a choice to show up when it would have been easier not to.”
One story in 9:16, 4:5, 1:1 or 16:9, made in your browser.
Tap through at your own pace, or let it ride with music.
MP4 at 30 fps, sized for stories, feeds and screens.
Made on your device. No queue, no upload.
Besides the video: every stop as an image, one PDF, and a card for your links.
Public pages only show what is already public on GitHub.

Yes. Type any GitHub username at the top of this page to watch a recap of its public 2026 activity. Sign in only to include your private contributions.
No. Signing in asks GitHub for no repository permissions, and it only reads the counts GitHub keeps about your activity.
Your contributions to private repositories, your own and your organisations', count toward your total. Your public page and its card never name them. Your own story and files show their names only if you choose to, in Settings.
Your yearly total matches the profile. On a few days GitHub's public graph files one contribution on the neighbouring day, so active days can differ by one or two.
Yes. Make an MP4, every stop as a PNG in a ZIP, or one PDF, each in 9:16, 4:5, 1:1 or 16:9, plus a share card. They are made in your browser, so keep the tab open while a video renders.
Sign in and open Settings. Hide my public recap takes your page down. Delete my data removes your recap and account, hides your public recap and revokes WrapYourGit's access to GitHub.
One sign-in, a short wait while we read your year, and the story is ready.
An independent project, not affiliated with GitHub. Signing in happens on github.com and gives read-only access.


